You or your loved ones may have experienced pain or discomfort in the left side of your chest. We all worry about our heart health with the slightest pain in this area and see a cardiologist right away. The doctor's first step in checking heart health is to order an ECG or EKG test. An electrocardiogram allows the cardiologist to examine problems and perform the necessary treatment with the help of curves and waves. But how can a doctor diagnose heart problems with the help of curves? This is done with the help of ECG interpretation (ECG or EKG), which in this article we want to fully address this issue. Stay with us.
")
An electrocardiogram (ECG or EKG) is a simple test that can be used to check the heart rhythm and electrical activity. The test uses sensors that attach to the skin to detect and detect electrical signals generated by the heart at each beat.
These signals are recorded by a device and then the doctor examines them to see if the heart condition is abnormal.
Although electrocardiograms and echocardiograms are similar in name, they are different tests. Electrocardiogram is an ECG and echocardiogram is a heart scan.
ECG is often used in conjunction with other tests to help diagnose and assess heart health. ECGs can be used to check for signs of a possible heart problem, such as chest pain, palpitations, dizziness and shortness of breath.
An ECG can help diagnose the following:
• An arrhythmia in which the heart beats too slowly, too fast, or irregularly;
• Coronary heart disease, in which the blood flow to the heart is blocked or blocked by the accumulation of fatty substances.
• Heart attacks in which blood flow to the heart is suddenly blocked;
• Cardiomyopathy in which the walls of the heart become thick or enlarged.
A series of ECGs can also be done over time to monitor the heart condition of a person who has already been diagnosed with heart disease or is taking medications that potentially affect the heart.
The normal cycle of the heart begins with the spontaneous depolarization of the sinus node; The sinus node is a specialized area of tissue located in the upper right atrium (RA). A wave of electrical depolarization then propagates through RA across the septum between the atria to the left atrium (LA).
After complete depolarization of the heart, the myocardium must be depolarized so that it can be depolarized again for the next cardiac cycle.

In medicine, for easy interpretation of the ECG, all its components are contractually named. ECG paper is marked with a grid of small and large squares. Each small square represents 40 milliseconds (ms) of time along the horizontal axis, and each larger square contains 5 small squares, so it represents 200 milliseconds. Standard paper speeds and square symbols make it easy to measure cardiac intervals, and ultimately help calculate heart rate and detect abnormal electrical conduction in the heart.
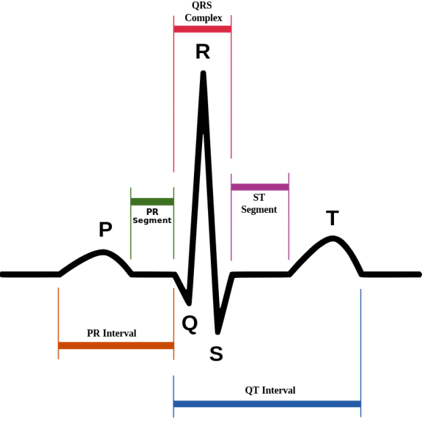
In the image below, we show the contract name of each ECG component:

| P Wave |
The first wave on the ECG is the P wave, which is generated by the passage of electrical current through the atria. |
| PR distance |
The interval between the beginning of the P wave and the beginning of the QRS complex is called the PR interval. This distance indicates the time elapsed for the depolarization wave to reach the atria to the ventricles. |
| QRS complex |
The QRS set consists of three waves, the sum of which indicates ventricular depolarization. |
| ST |
The ST segment starts at the end of the QRS complex and continues until the beginning of the T wave. The ST fragment shows the early stages of ventricular repolarization. |
| T wave |
The T wave is a round, positive wave that follows the QRS complex and represents the final stages of ventricular repolarization. |
| QT distance |
The QT interval is the distance from the beginning of the QRS complex to the end of the P wave and indicates the time required for the total activity of the ventricles in a cardiac cycle. |
| U wave |
The QT interval is the distance from the beginning of the QRS complex to the end of the P wave and indicates the time required for the total activity of the ventricles in a cardiac cycle. |
To interpret an ECG or EKG, seven steps are needed, which we will discuss in the rest of this section. But the important thing is that the doctor receives a complete history of the patient before starting to interpret the ECG. Age, gender, medical history, and medications used to influence ECG scans. The timing of the ECG and its cause are also important.
Step 1: Determine your heart rate
Step 2: Determine heart rhythm
Step 3: Determine the electrical axis of the heart
Step 4: Determine the PR distance
Step 5: Examine the QRS complex
Step 6: Investigate repolarization
Step 7: Check the R / S ratio

The heart rate can be determined by the speed of the paper and the distance between the 2 R waves. There are 2 paper speeds: 25 and 50 mm / s
If the paper speed is 50 mm / s, one minute is equal to the length of the strip 3000 mm or 600 large squares (1 large square equals 5 mm):
Heart rate (beats per minute) = 600 / number of large squares between 2 waves R.
Determining the heart rate is easier with the help of ECG ruler.
|
heart beat |
Condition |
Sample |
|
< 60/min Less than 60 beats per minute |
Bradycardia |
An image of a sinus bradycardia problem
|
|
60–100/min Between 60 and 100 beats per minute |
Normal heart rate |
Heart rate with normal RR interval
|
|
> 100/min More than 100 beats per minute |
Tachycardia (rapid heartbeat) |
Sinus tachycardia
|
If the person's heart rate is normal, the ECG will look like this:

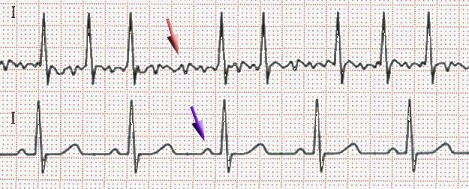
When interpreting heart rhythm, you should pay attention to P-waves, which are a sign of atrial stimulation. When a QRS complex appears after each P wave, the ECG shows a sinus rhythm.
If the P-waves are irregular, there is probably a sinus arrhythmia. If P-waves are not present at all, the following differential diagnoses should be considered:

The electrical axis of the heart is either determined using the Cabrera circle, which is a complex method, or is determined by examining the QRS complex waves (at limb leads I, II, and III).

Since the second method is simpler, remember the following golden rules for determining the axis of an electric heart:
 ECG showing ECG deviation to the right
The normal PR interval is between 120 and 200 milliseconds (0.12 - 0.2 seconds). A PR distance of more than 200 milliseconds indicates a first-class block of the AV node.
|
AV block |
|
|
|
Type I |
 |
|
|
Type II |
Wenkbach Block |
|
|
Type II |
Mobitz Block |
|
|
نوع III |
||
The normal QRS complex consists of a small negative Q wave (amplitude smaller than R R wave) as well as small R and S waves. The physiological QRS duration is 60 to 100 milliseconds (0.06-0.1 seconds).

• Ventricular extrasystole (VES; no previous P-wave)
• Navigation system disorders
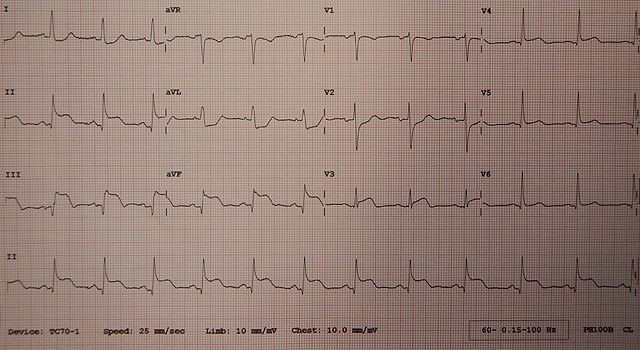
Repolarization consists of the ST segment and the T wave (polarization of cavities). The standard ST piece is an isoelectric line. Therefore, the rise and fall of the ST segment are considered pathological abnormalities (especially less than 1 mm in limb leads and less than 2 mm in chest leads).

The most important causes for such an ST wave surge are acute myocardial infarction (AMI) and acute pericarditis. In the case of AMI with ST-segment elevation (myocardial infarction with ST-segment elevation), the ST segment exits the descending part of the R-wave, while in the case of pericarditis, the ST-segment exits the ascending part of the S-wave.
R-wave height usually increases in breast leads, while S-wave decreases; The S wave is not completely present in the V6. The R / S ratio is considered to be the region where the R-wave is higher than S (usually between V2 and V3 or V3 and V4). If this is not the case, the condition is known as poor R-wave progression, which may be a sign of myocardial infarction or left ventricular hypertrophy.
In this article, we have thoroughly reviewed ECG interpretation (ECG or EKG) and seven stages of ECG interpretation. ECG interpretation is the best way to find out your heart health status. An ECG test is a painless test that is easy to perform and can help detect heart arrhythmias and problems.

.png)


